Ray Tracing Tools
PI: Kaveh Pahlavan
Personnel: Ganning Yang, Tim Holt, Yan Xu, Prashant Krishnamurthy, Jacques Beneat
Sponsored by NYNEX Science & Technology and WLRL
Indoor and outdoor radio channel propagation modeling has been performed extensively at CWINS. In addition to channel measurements, 2D and 3D ray tracing software have been developed for accurate radio propagation predictions in micro and pico-cellular environments. The predictions from ray tracing software are particularly accurate for propagation of radio signals at frequencies greater than 900 MHz where electromagnetic waves can be described as traveling along localized ray paths. Three basic mechanisms considered in ray tracing are: (a) transmission and reflection (b) diffraction and (c) scattering.
Usually in indoor areas, reflection and transmission dominate diffraction or scattering. In urban areas however, diffraction around the corner or over the roof of a building can not be neglected. In indoor areas, the additional accuracy of 3D ray tracing or of FDTD technique can be minimal compared to 2D ray tracing. The fast computation times of a 2D ray tracing and the ease of use of 2D representations make 2D ray tracing particularly attractive. A 2D ray tracing program called XRAY was originally developed at CWINS in the early 90s operating in a UNIX environment using X-Windows for the GUI. The 2D ray tracing computational engine has since been incorporated into a larger Windows based software tool called PlaceTool for optimum deployment of indoor wireless systems.
The other ray tracing software developed at CWINS is a 3D ray tracing software with both Unix and Windows versions. Due to the difficulty of 3D representations, no custom made GUI was created. However, conversion programs from AutoCAD have been developed. The 3D RT includes complete electromagnetic treatment of the rays including complex antenna patterns, tracking of complex parallel and perpendicular wave components upon reflections/transmissions, and advanced diffraction and scattering mechanisms. The software has been used with excellent correlation to measurements in New York City for urban microcell signal coverage predictions.
Below are some screen captures of the PlaceTool software illustrating the 2D ray tracing option.
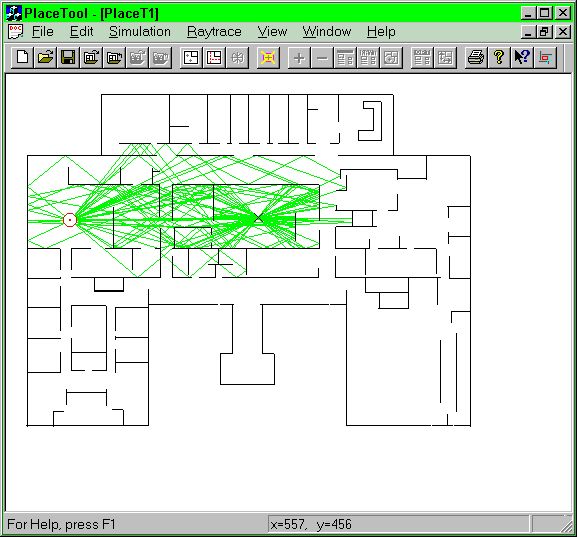
The floor plan used in this example corresponds to the first floor of Atwater Kent Laboratories at WPI. The floorplan can be directly drawn by using the mouse. The transmitter (red circle) and receiver (black cross) are placed on the floor plan by a simple drag and click of the mouse. The software also allows for more than one receiver.
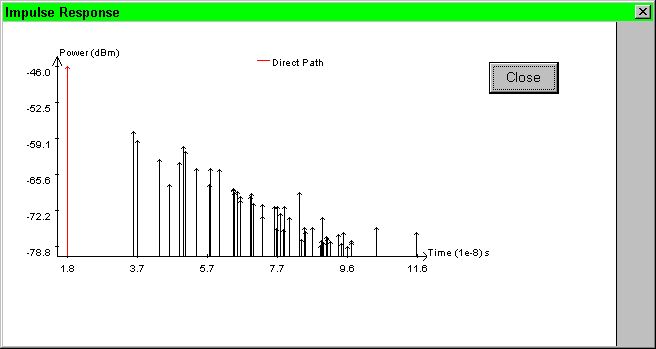
By double clicking the receiver the impulse response associated with the transmitter-receiver pair can be displayed. All information can be saved to file.
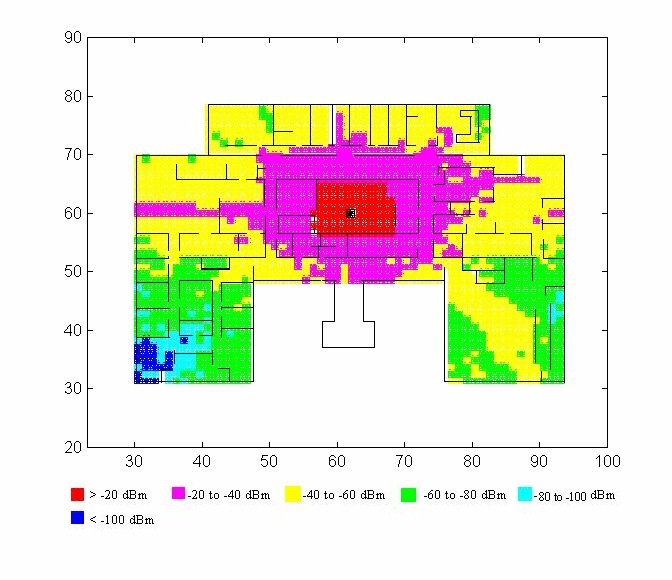
Average received power coverage maps can be obtained when specifying a single transmitter location. In this example, the transmitter power was 27 dBm or 0.5 W and the repartition of the received power in the building can be easily seen.
This coverage map is more accurate than maps obtained using general indoor statistical models since it uses a specific data related to the floor layout.